Tuesday, June 13, 2006

Rally Might Commence End of Next Week, But Secular Bear Market Has Resumed

The equity market is very oversold and I expect that a rally will commence around the end of NEXT week. The rally should last for about 3 to 4 weeks until roughly the later part of July, and then the decline will resume.
 
EXPLANATION:
 
Japanese Quantitative Easing as well as aggressive monetary accomodation by the US Federal Reserve resulted in the mother of all liquidity cycles from 2002 to early 2006.

All the liquidity generated by Japan did not find its way back into Japan because Japan was (and still is, and still will be in the foreseeable future) running a trade surplus. Instead the printed money found its way into the world, and ultimately into the hands of the big hedge funds who used it to plow into speculative assets like emerging market equities and spread products, in the biggest carry trade the world has ever seen.

The US Fed's monetary easing led to the housing bubble which helped in a great way to bail the economy out from the fallout of the tech/internet bubble and ingnite a good sized economic recovery. US liquidity managed to find its way back into the domestic market, quite unlike the case for Japan, because the US was (and still is, and still will be for the forseeable future) running a large (humongous?) trade deficit and consequently is the prime beneficiary of mercentalist currency sterilization by foreign central banks.

But with the Fed forced to tighten into an economic slowdown (much as it does not wish to) and Japan having ended is QE policy and is looking set to end is ZIRP policy, the stage of set for the mother of all liquidity cycles to morph into the mother of all liquidity contractions.

The incessant inflation talk, synchonous rate hikes by central banks around the world, and the recent violent reaction of global equities and spread products to the downside is only the first step in what will be an ongoing and increasing volatile process known as MEAN REVERSION.

My take therefore is that the secular bear market in equities that began in early 2000 and which was interrupted by a counter-trend rally from 2003 to early 2006 has resumed in full force.


_____________________

"In the short run the market is a voting machine, but in the long run it is a weighing machine."
--- Ben Graham

"Risk does not arise from price changes, but from miscalculation of intrinsic value."
--- Warren Buffet

Send instant messages to your online friends http://asia.messenger.yahoo.com

Monday, June 05, 2006

Broad Weakness

We are weaker overall as the day starts. I am not tempted to add into weakness at this stage.

Futures Weaker

The futures are weaker as Iran threatens to disrupt oil supplies if pushed the wrong way.

_____________________

"In the short run the market is a voting machine, but in the long run it is a weighing machine."
--- Ben Graham

"Risk does not arise from price changes, but from miscalculation of intrinsic value."
--- Warren Buffet

Send instant messages to your online friends http://asia.messenger.yahoo.com

Saturday, February 25, 2006

A lesson on momentum and reversal pivots

Chris Schumacher ...

The right side of the head-and-shoulders pattern is still forming on the daily chart. This typically leads to a coil within a base so that when support fails, it fails hard. This is what I was hoping to avoid in the first quarter. There have been enough entry points available to bulls who wanted to go long from 1635 and 1650 that I was hoping the bulls could create momentum at highs rather than from lows. When momentum comes from lows, it exhausts itself just to get back to resistance.

When indicators are mixed ...

Helene Meisler

I can't recall the last time the indicators were so mixed.

The 30-day moving average of the advance/decline line has been overbought since the beginning of the year, keeping a lid on any rally. Meanwhile, the oscillator has moved back and forth between overbought and oversold, giving us rallies and declines that last no more than a few days at most.

This has translated into a McClellan summation index that has gone nowhere as well. I can't recall another time when it would take a net differential of less than 1,000 issues on the A/D line to move the indicator from down to up or vice versa. It seems that each time it gets in gear going one way, it immediately snaps back to the other. And then when it feels like it's back in gear that way, it changes again.

Usually this indicator gets to the point where it requires a big net differential to move it, but that's presently not the case. Several up days in a row would turn it upward whereas several down days would turn it lower. Yet we can't seem to get several days of anything in a row!

Then there are the new highs and new lows. The raw data, as I mentioned here Thursday, aren't very good. They are telling us how narrow each rally is getting. Yet the 10-day moving average of the net differential of highs and lows is currently trending upward. Typically the market moves in the direction of the 10-day moving average. I suppose we might call this an up week, but there hasn't been the vigor we've come to expect.

Then there's sentiment. The Investors Intelligence readings clearly show too many bears and too few bulls. That would have us believe we are close to a low in the market.

The 10-day moving average of the put/call ratio shows something different. It's currently heading back toward the bottom of the page. Typically moves from the bottom of the page are associated with market highs, not lows!

But it's the volume that is the real conundrum. The 30-day moving average of upside volume as a percentage of total volume has dipped below 50%. Normally a reading in the low to mid-40s would be associated with a low in the market. So it's drifting toward a low in the market, not a high.

All the data leads me to think that a decline here would lead to a good rally, not a massive bear market.

Let's say the put/call ratio is correct and we aren't quite done rallying. So we rally a few more days. But being so low already, the put/call ratio is telling us this rally would be short-lived. That's also what the new highs are telling us, and the overbought oscillator and the 30-day moving average of the A/D line, which isn't yet oversold.

But if the Investors Intelligence readings are correct, then a decline after that rally would only lead to more bearishness, not more bullishness. And more bearishness is bullish.

Then let's go back to the volume chart. It's telling us that if we do end up getting a whack in early March, we can very well get that indicator down to the bullish zone quickly.

So what we really need to get a trend to trade is a short-term rally that lasts into next week, followed by a solid whack to the downside. This would set us up for a springtime rally that could last more than two or three days.

The problem with well known technical patterns

Rev Shark ...

A lot of folks have been pointing at developing head-and-shoulders top patterns in a number of indices as a reason to be worried. I certainly can see what they are talking about, as can just about anyone else who looks at the chart.

However, it is my experience that it is a pattern that seldom works. I would guess that the head-and-shoulders pattern is probably the most well known of all technical patterns, which is why it doesn't tend to work that well.

When everyone sees and expects the same things, they act in anticipation. The sellers who are worried about a head-and-shoulders top do their selling before it is fully formed, which tends to undercut its development.

We see the same problem with breakouts at times as well. When they are well anticipated, they are often sold and fail. Technical patterns can't be considered in a vacuum. You also have to think about the emotions that surround them. When anticipation that a particular pattern may play out is running very hard, the chances of a quick failure are also high.

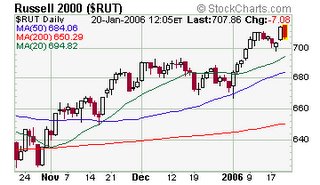
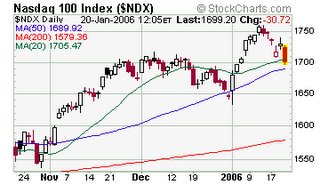
Saturday, January 21, 2006

Longs become increasingly risky as market gets overbought

Many market participants were bullish about Wednesday's and Thursday's bounce after a sharp pullback and were calling it a good time to add to long positions.

However, long positions become risky when the short term oscillator becomes maximum overbought, as it did so on Wednesday.

Coupled with the fact that the intermediate term indicators are still in neutral to overbought territory, this makes it very risky to play the long side.

Indeed, despite the initial bullish outlook today, the market has faded hard and fast, catching the over-eager bulls once again.


Longer term, the market still looks healthy and the intermediate term uptrend is still intact.


Thursday, December 29, 2005

A Lesson On Thin Markets

Finish each day and be done with it. You have done what you could. Some blunders and absurdities no doubt crept in; forget them as soon as you can. Tomorrow is a new day; begin it well and serenely and with too high a spirit to be encumbered with your old nonsense.

-- Ralph Waldo Emerson


I will quote Chris Schumacher on the topic of trading thin markets:

I suspect the thin markets are allowing some traders to push price past certain levels only to see those positions brought in immediately, creating the sharp spike reversals that we saw Wednesday. The sharp spike lower from the open led to a quick spike back to just under 1670. Another quick spike over 1670 led to a final quick spike lower before the close. Quick spikes are not indicative of a smooth and heavily traded market and they don't offer confidence for bias creation. They are more for fast-fingered traders.

Thursday's trading session should offer more of the same. Although the 1670 level failed to act as a support again, I'm not quick to jump on the bearish bandwagon for the simple reason that we saw similar action last week that led to another move to the 1690 magnet level. Ideally this will happen again Thursday. If 1660 holds as support, a move to 1690 would throw the wrench right back in the face of the bears. As the coach in the movie "Dodgeball" might say, "If you can dodge a wrench, you can dodge a bear trap."

I'll be looking for price action Thursday to hold this level and push the index back near 1690 by Friday. Should the index close under 1660, then my bias will have failed.


Wednesday, December 21, 2005

Somtimes it does not pay to short weakness!

Do not be tempted to short weakness every time the market does an ugly reversal. Chris Schumacher explain it best ....


Monday's trading on the Nasdaq 100 gave the bears reason to rejoice. After early congestion around 1690, the index dropped steadily for most of the day, breaking through support at 1670. This changes the landscape for the rest of the week.

The bulls can draw consolation from the fact that while there was strong price action to the down side, the volume on the trading proxy QQQQ was relatively light at about 75,000,000 million shares traded. When I see strong price declines in the index, I want to see over 100,000,000 million shares traded to indicate that there is a strong willingness to sell positions.

Therefore, from a technical standpoint, the break of 1670 shouldn't put the ball back into the hands of the bears. Typically after moves like we saw Monday, there is either a base near lows or a slight reversal back into the range. There should be a low probability of a move lower in the morning session Tuesday.

The bulls/bears scenario has obviously shifted a bit to the side of the bears, but a close back above 1670 on Tuesday would negate this and keep the bulls firmly in control of the longer-term uptrend that formed from support at 1535-40. Should the index continue to drop Tuesday and Wednesday, the next support level would be at 1635, which has provided strong resistance through most of 2005. It is likely to be the next liquidity level, much like 1690 acted as a liquidity level last week.

I would like to see the bulls step into this selling and move the index back above 1670 Tuesday. Should 1670 fail to break in the morning session, the probability of seeing the index move back into the range into the close would be lower.


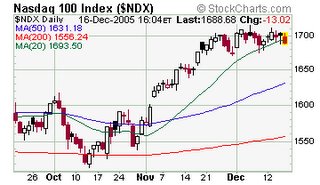
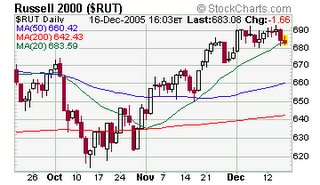
Saturday, December 17, 2005

Market likely to remain rangebound next week


I would expect that the Monday following expiration would reverse (at least initially) the intraday trend which is prevalent on expiration Friday. Since the trend today has been down for the most part, I expect Monday to begin on a positive note.
 
However with volatility low, sentiment complacent, and market internals having been struggling for quite a while, I also expect rallies not to have any significant momentum either in price or time. On the other hand, the market has several layers of support should downside reassert itself. Given that positive seasonality would exert some upward bias, my take is that range-bound action should continue to dominate.
 
Support on the SPX is 1265 followed by 1250, and that of the NDX is 1688-90 folowed by 1670-72. Dips to these support levels should present short term buying opportunities.
 

Thumbs Down for options expiration


I hereby give the price action on this options expiration day a big thumbs down!